- Cascade
Before diving into the topic at hand, let’s begin with a quick introduction of myself, and my role at Cascade. Cascade recently established a Client Solution Center, including both a Project Delivery Group and a Center for Technical Excellence. My name is Seth Pitkin and I currently serve as the Director of the Center for Technical Excellence with 32 years of experience in site characterization and remediation along with colleagues with decades of experience in thermal and injection-based remedies. Following postgraduate training at the University of Waterloo in the early 1990’s, it became clear to me that conventional approaches to site characterization have typically resulted in underperforming remedies, evident in the project’s excessive expenditures and long-time periods. The reasons for this basically center on inaccurate or incomplete Conceptual Site Models (CSMs) which result from 3 primary issues:
- Site characterizations are typically performed at a degree of spatial resolution that is far too low to support an adequate understanding of the site
- A failure to adequately understand the nature and location of the source(s) including whether or not DNAPL is present
- Lack of understanding of the nature and degree of transport pathways versus contamination storage ones in the low permeability materials controlled by diffusive processes
The goal of this post is to provide you with some new ways to approach your projects by explaining how Cascade approaches site characterization. Cascade is unique in that we bring together the field service tools, technologies, and expertise to support our consulting company clients as partners in meeting their client’s needs. From the initial conceptual model, to project completion, we utilize our expertise in the application of these tools, technologies, and approaches to maximize our client’s success.
A US EPA Lead Approach
To better understand how we approach site characterization at Cascade, let’s review a few publications from the United States Environmental Protection Agency. You will see how our processes quickly align with their findings. The US EPA has undertaken a systematic approach to evaluating how the sites under its control (i.e., Agency-led CERCLA projects) have performed as well as to undertake optimization of site activities, such as saving time and money. These approaches are described in two relatively recent publications:
- Superfund Remedy Report 15th Edition EPA 542-R-17-001 Office of Land and Emergency Management July 2017
- Superfund Optimization Progress Report 2011 - 2015 EPA-542-17-002 Office of Land and Emergency Management
Superfund Remedy Report - 15th Edition. EPA 542-R-17-001 Office of Land and Emergency Management July 2017
Since the beginning of the Comprehensive Environmental Response, Compensation and Liability Act (aka CERCLA or the Superfund Program) in 1980 through 2014, a total of 5,197 decision documents (RODs and ROD Amendments and ESDs) for 1,549 Superfund sites have been lodged. These decisions, including whether or not remedial action is required, what media require remediation, where the sources are, what remedial technology(ies) to use and the site-specific design of these remedies, result in large expenses associated with engineering in complex, disturbed natural systems, also known as remediation. Lifecycle costs are directly correlated with uncertainty in making these decisions. The average cost of cleanup of a CERCLA site was around $34 million as of 1994 (Linly Ferris & David Rees, CERCLA Remedy).
- Selection: Abandoning the Quick Fix Mentality, 21 Ecology L. Q.785 (1994). http://scholarship.law.berkeley.edu/elq/vol21/iss3/4) with the average cost of an RI/FS at around $1.3 million (exclusive of transaction costs) and took about 8 years to complete through remedy construction.
The nature of remediation has been changing over the years for all media and particularly for source remedies and groundwater remedies. The fifteenth edition of the Superfund Remedy Report records that forty-six percent of sites had source remedies selected. In situ treatment for sources was selected at 23% of the sites and at these sites the most common technologies were:
- SVE at 7%
- Chemical at 6%, and
- Thermal at 5%
The remaining 5% of sites included bioremediation, solidification/stabilization, cap, soil amendments, fracturing, multiphase, and phytoremediation. 54% of site decision documents selected multiple approaches for source material from 2012 to 2014.
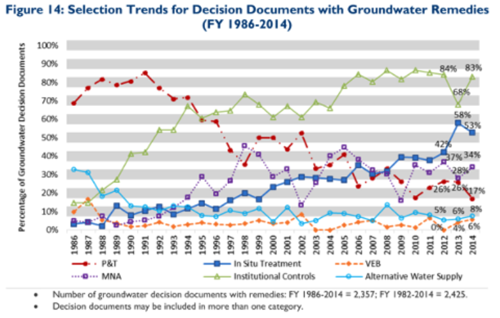
Groundwater remedies were selected at 84% of sites. Pump and treat has declined from a high of nearly 90% of sites with remedies in 1991 to a low of 17% in 2014. In situ treatment has increased from a low of 0% in 1986 to a high of 58% in 2013 as shown in the plot below.
Between 2012 and 2014, 52% of sites had a groundwater remedy and 51% of these sites utilized an in situ remedy. Bioremediation was selected 29% of the time and chemical treatment was selected 23% of the time. The next 3 most common remedies were used sparingly (PRBs 4%; air sparging 3%, and Thermal 3%) for groundwater. Combined remedies (both spatial and temporal) have seen increased usage since 2012.
Of all the Records of Decisions (RODs) issued between 1988 and 2014, 26% required a subsequent Explanation of Significant Differences to be filed, meaning that some aspect of the site or the nature of the problem was not adequately understood prior to issuance of the ROD.
In short, while remedies are becoming more effective and faster than they initially were in the heyday of pump and treat, they are more complex and require a better understanding of the subsurface systems than ever before.
Superfund Optimization Progress Report 2011 - 2015 EPA-542-17-002 Office of Land and Emergency Management
EPA began doing optimization reviews on some of its sites in 1997 as part of a recognition that pump and treat remedies were not yielding the expected results. In 2012, EPA issued the National Strategy to Expand Superfund Optimization Practices from Site Assessment to Site Completion (“the Strategy”) to expand the optimization review program including many newer remedial approaches. Since 1997 a total of 194 sites have gone through the optimization process.
Approximately 35 percent of the optimization events included in the report were conducted in pre-remedial phases of the Superfund pipeline, 51 percent during remedial action phases, and 14 percent during operation and maintenance.
68 percent of the sites had recommendations for improvements to the conceptual site model (CSM), 60 percent of the sites had streamlined or improved monitoring recommendations, 39 percent of the sites had improved system engineering, and 36 percent of the sites had a change in the remedial approach.
We can draw some conclusions from this:
- The need for a change in the remedial approach at 36% of sites is very likely directly related to the need for improvements to the CSM. In other words, if the site wasn’t properly understood the subsequent remedy is unlikely to function cost-effectively. Given the approximate 30:1 ratio in cost for remediation versus site characterization, spending money more effectively on characterization will yield significant savings in remediation.
- Cost savings from streamlined or improved monitoring is likely due, at least in part, to the practice of investigating sites using monitoring wells which then end up being monitored for decades at great expense regardless of the utility of the data provided. Use of more appropriate investigation technologies could avoid these costs from the outset by avoiding the installation of wells until an efficient monitoring network can be designed based on a sound CSM.
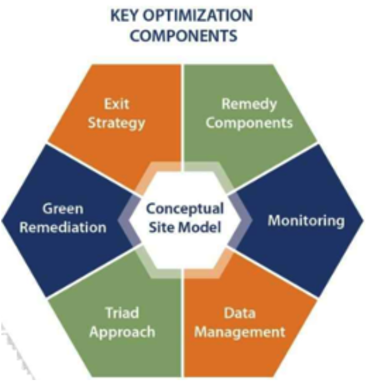
The figure above from the Optimization Report illustrates the components of the process. Not coincidentally the process centers on the CSM, which is the basis for all decisions made for the site.
Common findings/recommendations of the optimization process include:
- Use strategic sampling approaches (e.g., the Triad Approach)
- Improve the CSM through additional characterization, better use of existing data via improved data management and tools such as 3D visualization
- Improved data management (including use of 3D visualization tools)
- Change the remedial approach
- Use combined remedies
Site Characterization at Cascade
Cascade uses high resolution site characterization methods in conjunction with dynamic work strategies as incorporated in the Triad Approach. We support these efforts with state-of-the practice data management, utilizing Geographical Information Systems (GIS), and 3D interpolation and visualization. These approaches save both time and money over the project lifecycle and can be incorporated at any stage of the project from initial investigation through pre-design investigations. It is even possible to incorporate them during remedial operation if the remedy is not performing up to expectation. You can save further time and money by seamlessly integrating of our characterization and CSM services with our full range of remediation approaches as laid out in our most recent blog post You Knew Us As a Drilling Company – Now Experience the Full Suite of Solutions.
Categories
- Site Remediation
- Drilling
- Careers
- Cascade Chemistries
- Safety
- Site Characterization
- Thermal
- Rotary
- Sustainability
- In Situ Stabilizaton
- High Resolution Site Characterization
- Injection
- Sonic Drilling
- Automated injection
- corporate sustainability
- case studies
- in situ thermal remediation
- Cascade Drilling
- Over Water Drilling
- In Situ Stabilization (ISS)
- ISS
- Environmental Remediation