How HRSC Tools Provide Actionable Intelligence for Remediation Optimization
By: Kerry StonestreetInadequate site characterization is one of the main reasons remediation projects underperform or fail. Although no project is guaranteed success, a solid plan for site characterization can ensure you are well informed during remediation planning about challenges your site presents—and that begins by knowing what tools and technologies you have at your disposal. In this blog post, I’ll provide a high level explanation of common HRSC tools and the best uses of the data collected for each to optimize remedial design and field performance.
If you’d like a deeper dive into optimizing your existing or new sites, join me for tomorrow’s webinar, Taking HRSC Reporting to New Heights. I’ll be talking about advances in high resolution site characterization (HRSC) reporting technologies, and how those advances make possible the fast, accurate and reproducible ability to convert complex 3D data into actionable intelligence in the form of interactive 3D models and data summary documents.
MEMBRANE INTERFACE PROBE (MIP)
This tool that provides vertical profiles of the soil and detects the presence of volatile organic compounds (VOCs). This tool provides data that can be used to create visual representations of sites and can be collected in real time to monitor and optimize the remedy, and then also as it is applied. Learn more about MIP >>
HYDRAULIC PROFILING TOOL (HPT)
This tool measures and estimates hydraulic conductivity (K), which is necessary data for building a sound remediation approach, especially for injection remedies. The HPT works by injecting clean water into the subsurface and recording any changes to the associated pressure. This can be plotted in vertical profiles with respect to depth. Learn more about HPT>>
MIP AND HYDRAULIC PROFILING TOOL (MIHPT)
The MIHPT combines the above two technologies into one tool string, which allows multiple types of data to be collected from a single borehole. This is a fast, efficient and cost-effective way to identify source zones, plumes, transport zones and contaminant mass storage zones in regards to contaminant mass as it relates to lithology and K. Learn more about MIHPT>>
WATERLOOAPS ADVANCE PROFILING TOOL
The WaterlooAPS is used to detect and understand both vertical and lateral groundwater contamination in transmissive zones to quantify mass flux. It combines direction push K logging with high quality and discreet sample collection. Learn more about WaterlooAPS >>
ULTRA VIOLET OPTICAL SCREENING TOOL (UVOST)
The UVOST is a laser induced fluorescence tool used to identify, delineate and quantify LNAPL in the subsurface. Learn more about UVOST >>
OPTICAL IMAGE PROFILE (OIP)
This OIP tool uses optical technology to identify delineate and quantify LNAPL in the subsurface. Learn more about the OIP >>
Site characterization data can be collected in many formats from distinct data collection methodologies, from discrete soil and groundwater samples submitted to a lab for analytical analysis to the direct sensing tools above. It’s important to remember that one characterization tool or method may not always be sufficient—successful site characterization is often attributed to an informed and deliberate application of both lab analysis and direct sensing tools.
Tools like the MIHPT provide a wealth of vertically dense subsurface information in a nicely structured (but otherwise not particularly easy to use) data file, as shown below.
Figure 1- MIHPT Data File (18 of 34 data columns shown)
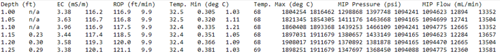
The data is there… but now what? What does this data set tell me about complex 3D spatial relationships in a useful context? Where is my contaminant mass and how is distributed? Where is it in relation to hydrostratigraphy? How do I communicate this deeper level of understanding to my design team, client, and external stakeholders?
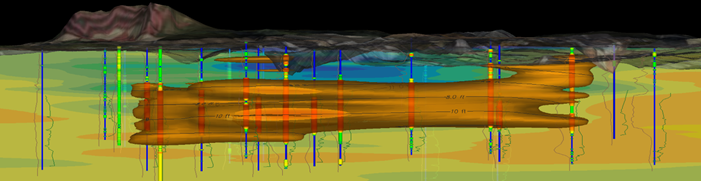
Join me for next week’s webinar, and I’ll explain how complex, dense subsurface data can be efficiently transformed into easy-to-use 3D models providing actionable intelligence to you and stakeholders.
We will cover the entire workflow, from using modern data science methods to transform raw data into organized spatial data, to preparation of geostatistical-based 3D models and how to use them to communicate your finding.
Join our newsletter

A bimonthly email with the latest expert insights in drilling and remediation