How to Detect NAPL Hydrocarbon Fuels, Oils and Tars in the Subsurface With the Geoprobe OIP System
By: Jason FlatteryDetecting non-aqueous phase liquid (NAPL) hydrocarbon fuels, oils and tars present in soil can be difficult, as it can be present as thin layers, ganglia, blebs or droplets of product in the formation matrix. For most environmental professionals, the Ultra Violet Optical Screening Tool (UVOST) has been the go-to option for solving NAPL delineation challenges, but a new direct measurement tool from Geoprobe may be worth considering as well. In this blog post, I’ll explain how the Geoprobe® Optical Image Profiler (OIP) system works and provide a general outline of its capabilities for high-resolution site characterization (HRSC) projects.
I will be hosting a webinar on April 10, titled “How to Determine If the Geoprobe Optical Image Profiler (OIP) Is the Best Fit For Your Project,” in which I’ll dive deeper into the tool characteristics, and explain how to determine if it’s the right choice for you. I'll be joined by Geoprobe Vice President Tom Christy to provide further detail and answer your questions.
REGISTER FOR THE WEBINAR NOW >>
The OIP system uses induced fluorescence and optical image capture/analysis to identify fluorescent NAPLs and quantify their relative preponderance. Either ultraviolet or green light sources can be used to induce fluorescence of the polyaromatic hydrocarbons (PAHs) present in the NAPL. The choice of probe depends upon the type and average molecular weight of the constituents present in the NAPL source (low molecular weight hydrocarbon fuels and oils that fluoresce in the UV/visible wavelength range, versus high molecular weight tars and creosote constituents that fluoresce in the green/infrared range).
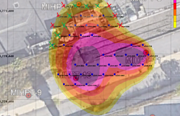
With either probe, light from an LED passes through a sapphire window in the probe wall and onto the soil. If product is present outside the window, the PAHs will emit fluorescence which is captured as discrete images through a camera window in the probe. The captured images are analyzed by the integrated software to determine the preponderance of NAPL within the image. The OIP probe also includes an electrical conductivity (EC) dipole and a Hydraulic Profiling Tool (HPT) to generate multiple streams of high-resolution data. The addition of these tools provides hydrostratigraphic information essential in building an accurate conceptual site model. The example log below shows these multiple data streams.
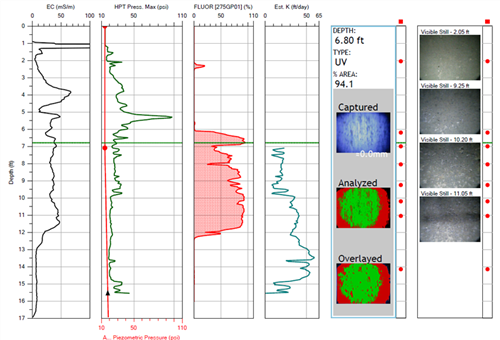
Logs depicting the level of fluorescence, and strings of high resolution images are produced and viewable in real-time. Two types of images are stored: a visible light image of the soil outside the probe tip, and the filtered image of the fluorescence created by the software. The images allow direct observation of soil grain size, structure, and color, which can provide valuable insights into the conditions under which NAPLs are present and distributed.
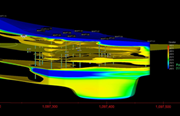
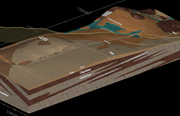
The level of realism provided by the live feed from the visible light camera during advancement can be exciting. On a recent project, our clients were watching as we drove into the NAPL layer, and the entire team was captivated as we witnessed the free product moving through the soil in real time. Another great use of the visible light images has been their inclusion in cross sections and fence diagrams. The color of the soil (and to some extent, the qualitative grain size information) from the photos provides an additional line of evidence when stitching together an interpretation of a transect of OIP points.
If you are interested in learning more about the best uses of the OIP tool, register for our webinar now.
Join our newsletter

A bimonthly email with the latest expert insights in drilling and remediation