What is an MIHPT?
By: Casey MooreSelecting the right tool is crucial when incorporating high-resolution site characterization (HRSC) into your site management strategy. To design the most effective strategy, a project manager needs to understand the purpose and objectives of the site investigation and the types of data each site characterization tool provides. This blog provides a quick rundown on the Membrane Interface Probe – Hydraulic Profiling Tool (MIHPT), its capabilities, and its value in your site characterization toolkit.
For a deeper dive, check out our on-demand webinar, Leveraging MIHPT Data for Optimized In Situ Remediation Approach.
What is a MIHPT?
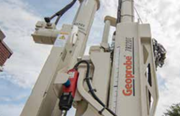
The MIHPT combines multiple tools into one: a Membrane Interface Probe (MIP), a Hydraulic Profiling Tool (HPT), and a diode for measuring electrical conductivity (EC). Advanced into the subsurface via direct push drilling technology, the MIHPT collects comprehensive data critical for strategic site management decisions.
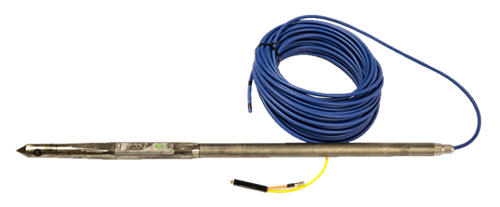
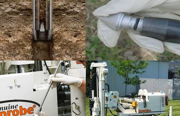
Figure 1: An MIHPT probe and trunkline. Source: Geoprobe
Membrane Interface Probe (MIP)
The MIP portion provides a continuous vertical log of the relative level of volatile organic compounds (VOCs). This semi-quantitative screening tool operates by circulating nitrogen gas past a semi-permeable membrane heated by a block at the probe tip. VOCs volatilize and pass through the membrane into the carrier gas, which transports them to surface detectors. The data from these detectors is displayed in real time.
Detectors on MIHPT Units:
-
Photoionization Detector (PID): Detects all VOCs, including petroleum hydrocarbons and chlorinated solvents, similar to handheld PID units used on-site.
-
Flame Ionization Detector (FID): Detects combustible volatiles, useful for characterizing petroleum hydrocarbon impacts.
-
Electron Capture Detector (ECD): Detects halogenated compounds, particularly sensitive to highly chlorinated compounds like PCE and TCE.
-
Halogen-Specific Detector (XSD): Detects halogenated compounds without the bias toward highly chlorinated compounds seen in the ECD. Running both ECD and XSD together provides comprehensive detection.
Hydraulic Profiling Tool (HPT)
The HPT creates a real-time log of relative formation permeability versus depth. It injects clean water at a constant flow rate through direct push rods and out into the surrounding soil. Sensors record the flow rate, back pressure, and probe depth. An estimated hydraulic conductivity (K) value is calculated and plotted in real time.
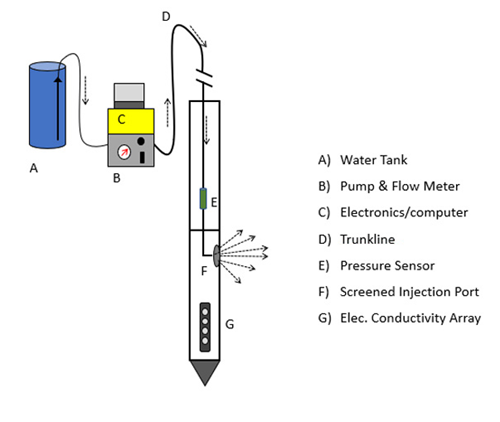
Figure 2: Generalized schematic of the HPT tool. Source: Geoprobe HPT Standard Operating Procedure
Electrical Conductivity (EC) Probe
The EC probe measures the electrical conductivity of soil, which varies with grain size, mineralogy, groundwater geochemistry, and contamination. Collecting confirmatory soil borings ensures the accuracy of EC data.
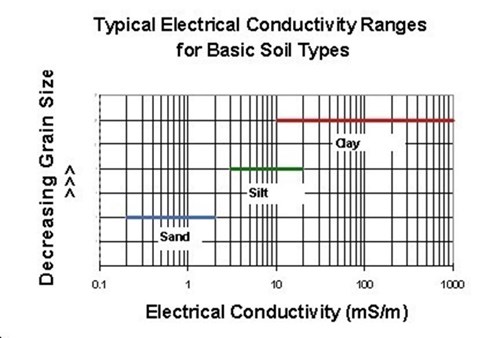
Figure 3: Relationship between electrical conductivity and grain size. Source: Geoprobe Electrical Conductivity System Standard Operating Procedure
Bringing It All Together
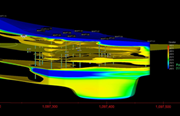
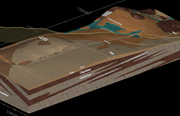
Combining geological, hydrogeological, and contaminant data into a single subsurface advancement with the MIHPT provides invaluable information. This method generates more detailed and comprehensive data in minutes or hours compared to traditional sampling methods that take weeks.
About the Author
Casey Moore
Operations Manager, Service Line Lead
[email protected]
Casey Moore is an HRSC service line leader and Operations Manager at Cascade with 12+ years of experience in the industry. He has managed a wide variety of complex projects utilizing HRSC tools in Cascade’s toolbelt including WaterlooAPS, MIP, OIP, UVOST, HPT & CPT. Casey assists clients and consultants to select the best method for specific contaminant delineation, from which data deliverables are invaluable to efficiently and cost effectively design and optimizing remediation plans.
Join our newsletter

A bimonthly email with the latest expert insights in drilling and remediation